

Statistiques sur le QI (Français - English)


Sommaire
- Extrait interview de Charles Murray (co-auteur de The Bell Curve)
- A lire en premier - Disclaimer
- Les chiffres
- Des hommes et des femmes (Différences sexuelles)
- Héritabilité du QI
- Corrélations du QI avec le corps
- Corrélations sociales du QI
- QI moyen de différentes populations
- QI moyen et éducation
- Corrélations QI - Éducation - Réussite professionnelle - Revenus
- QI moyen des professionnels de santé (USA)
- QI moyen et criminalité
- Impact sur le QI de différentes conditions (en points)
- QI des américains de 10 ans par groupe ethnique
- National IQ Dataset (NIQ), mai 2018
- Les données de Lynn et Vanhanen sur le QI moyen par pays
- Sources et références
- Pour en savoir plus (liens)
- Historique des versions
- Notes
Extrait interview de Charles Murray (co-auteur de The Bell Curve)
Philippe GOUILLOU : "Pensez-vous que le QI pourrait être un critère utile dans d'autres recherches ? Lesquelles ?"
Charles MURRAY : "Une meilleure question est de se demander quels seraient les phénomènes sociaux et économiques qui pourraient être compris sans prendre en compte le QI. De but en blanc, je ne peux en trouver aucun."
2 nov. 2004 : Interview exclusive de Charles MURRAY (co-auteur de The Bell Curve) en français sur Evopsy
A lire en premier - Disclaimer
Cette page (en construction) a pour objectif de rassembler le maximum de chiffres concernant le QI. Il ne s'agit QUE du report des résultats d'études scientifiques : aucune analyse n'est faite.
Pour avoir une explication des concepts statistiques (et des risques d'erreurs d'interprétation) voir :
Et pour comprendre les implications de ces corrélations, voir la FAQ Capitalisme cognitif :
This page is no more than a collection of statistics facts upon IQ: no analysis is done.
Aide
La colonne de gauche (REF) reporte aux sources qui sont détaillées en bas de page.
Les QI sont présentés selon la norme Wechsler (M=100, SD moyen=15 voir ci-dessous)
TBC = Herrnstein, R., & Murray, C. A. (1994). The Bell Curve: Intelligence and Class Structure in American Life. New York: The Free Press. ISBN: 0029146739
Brand 1996 = The g Factor - General Intelligence and its Implications - Christopher Brand
Jensen 1998 = Jensen, A. R. (1998). The g Factor: The Science of Mental Ability. Praeger. ISBN:0275961036
The fist column (REF) indicates the sources which are detailed at the bottom of the page.
IQ are calculated with M=100 and SD = 15

Les chiffres
1. Des hommes et des femmes (Différences sexuelles)
| Ref | DES HOMMES ET DES FEMMES (OF MEN AND WOMEN) |
HOMMES (MEN) |
FEMMES (WOMEN) | ENSEMBLE (TOGETHER) |
|---|---|---|---|---|
| QI Moyen (Average IQ) | 100 | 100 | 100 | |
| 14 | Ecart-Type (Standard Deviation) | 15,5 | 14,5 | 15 |
| 0 | Pourcentage de personnes ayant un QI supérieur à 100 (Percent of people with an IQ exceeding 100) | 50,00% | 50,00% | 50,00% |
| 0 | Pourcentage de personnes ayant un QI supérieur à 115 (Percent of people with an IQ exceeding 115) | 16,66% | 15,04% | 15,87% |
| 0 | Pourcentage de personnes ayant un QI supérieur à 130 (Percent of people with an IQ exceeding 130) | 2,65% | 1,93% | 2,28% |
| 0 | Pourcentage de personnes ayant un QI supérieur à 145 (Percent of people with an IQ exceeding 145) | 0,18% | 0,10% | 0,14% |
| 0 | Pourcentage de personnes ayant un QI supérieur à 160 (Percent of people with an IQ exceeding 160) | 0,006% | 0,002% | 0,003% |
| 16 | Pourcentage de femmes dépassant la moyenne des hommes en visualisation spatiale (Percent of females exceeding The male median in spatial visualization ability) | 25% |
2. Héritabilité du QI
| Ref | HERITABILITE DU QI (IQ HERITABILITY) | Corrélation (Correlation) |
|---|---|---|
| 1 | Jumeaux Monozygotes élevés ensemble (Monozygotic Twins reared together) | 0.86 |
| 2 | Jumeaux Monozygotes élevés ensemble (Monozygotic Twins reared together) | 0,85 |
| 2 | Jumeaux Monozygotes élevés séparément (Monozygotic Twins reared apart) | 0,74 |
| 2 | Jumeaux Dizygotes élevés ensemble (Dizygotic Twins reared together) | 0,59 |
| 2 | Frères et soeurs élevés ensemble (Siblings reared together) | 0.46 |
| 1 | Frères et soeurs ou Dizygotes élevés ensemble (Siblings or Dizygotic Twins reared together) | 0.45 |
| 2 | Enfant et Moyenne des parents, vivants ensemble (Mid-parent / Child together) | 0,50 |
| 2 | Enfant et parent célibataire vivant ensemble (Single parent / Child together) | 0,41 |
| 1 | Frères et sœurs ou Dizygotes élevés séparément (Siblings or Dizygotic Twins reared apart) | 0.40 |
| 13 | Entre Mari et Femme (Between Husband and Wives) | 0,45 |
| 17 | Entre Mari et Femme (Between Husband and Wives) | 0,37 |
| 18 | Entre Mari et Femme aux USA (Between Husband and Wives in USA) | 0,33 |
| 1 | Demi-frères et demi-soeurs élevés ensemble et vivant dans le même milieu (Half siblings reared together) | 0.20 à 0.30 |
| 2 | Enfant et parent célibataire vivant séparés (Single parent / Child apart) | 0,24 |
| 2 | Parent adoptif et enfant vivants ensemble (Adopting parent / Child together) | 0,20 |
| 1 | Cousins et cousines élevés ensemble et vivant dans le même milieu (Cousins reared together) | 0.15 |
| 20 | Personnes sans parenté génétique élevées ensemble : pendant l'enfance (Individuals without any genetic parenty reared together : during childhood) | 0,25 |
| 20 | Personnes sans parenté génétique élevées ensemble : à maturité (Individuals without any genetic parenty reared together : when adults) | - 0.01 |
| 19 | Evolution de l'héritabilité avec l'âge (broad heritability according to age)_: - Enfants _(Children) - Adolescents et jeunes adultes (in adolescents and young adults) - A Maturité (Later maturity) |
0.40 à 0.50 0.60 à 0.70 Presque (approaches) 0.80 |
3. Corrélations du QI avec le corps
| Ref | CORRELATIONS DU QI AVEC : | Corrélation |
|---|---|---|
| 7 | Taille de la tête (Head size) : Estimation en 2000 | 0,40 |
| 44 | Taille de la tête (Head size) : Méta-Etude 2022 | 0,26 |
| 9 | Conservatisme social[a] (Social conservatism) | -0,45 |
| 16 | Myopie (Myopia) | 0.20 à 0.25 |
| 30 | Symétrie du corps (Body symmetry) | 0.39 |
| 46 | Blancheur de la peau au Japon par préfecture (Skin color in Japan) | 0,42 |
| 46 | Taille au Japon par préfecture (Height in Japan) | 0,52 |
[a] Voir : FAQ Intelligence 7.4. Les électeurs de gauche sont-ils plus intelligents ?
4. Corrélations sociales du QI
| Ref | CORRELATIONS DU QI AVEC... | |
|---|---|---|
| 25 | Religiosité (pourcentage de gens répondant que la Religion est "très importante") | -0,886 |
| 41 | QI moyen et athéisme (137 pays) (Average IQ and Atheism in 137 countries) | 0.60 |
| 37 | QI Verbal et Conservatisme social[a] | -0,32 |
| 37 | QI Verbal et Conservatisme économique[a] | 0,10 |
| 8 | Niveau d'agressivité en école primaire (Agressivity in Primary School) | -0,45 |
| 23 | Réussite économique | 0,757 |
| 15 | Notes de performance professionnelle (Job Performance Rating) | 0.53 |
| 26 | Taux de suicide (remarquer les corrélations positives) : Hommes Femmes |
0,36 0,49 |
| 32 | Correlation du Facteur g avec la réussite académique (Relationship between academic achievement and general intelligence) | 0,81 |
| 33 | Poursuite jusqu'à la Graduation (équiv. Bac + 4) à partir du 7th Grade (équiv. 5° : 12-13 ans) QI < 85 85-94 95-104 105-114 >115 |
4 54 63 76 86 |
| 46 | Le taux de divorce au Japon (par préfecture) | -0,69 |
5. QI moyen de différentes populations
| Ref | QI STANDARD MOYEN | QI | > 100 |
|---|---|---|---|
| 4 | Noirs Américains (en moyenne à 75-80% d'origine Africaine) | 85 | 16% |
| 0 | QI du Baccalauréat si 80% de la population doit l'obtenir | 88 | |
| 22 | France : QI Moyen de l'enfant si le père est Manoeuvre | 92 | 30% |
| 3 | Population carcérale aux USA | 92 | 30% |
| 22 | France : QI Moyen de l'enfant si le père est Agriculteur | 96 | 41% |
| 3 | France : Equivalent du Baccalauréat (avant réforme visant à admettre 80% de la population au Bac...) | 100 | 50% |
| 22 | France : QI Moyen de l'enfant si le père est Employé de Commerce | 100 | 50% |
| 4 | Asiatiques (Extrême Orient et Indiens) | 106 | 66% |
| 22 | France : QI Moyen de l'enfant si le père est Cadre Moyen | 107 | 30% |
| 22 | France : QI Moyen de l'enfant si le père est Cadre Supérieur | 112 | 78% |
| 4 | Ashkenazes | 115 | 85% |
6. QI moyen et éducation
| Ref | QI STANDARD MOYEN DANS LE SYSTEME EDUCATIF | QI | > 100 |
|---|---|---|---|
| 34 | Primary School Graduate (USA) | 100 | |
| 34 | High School Graduate (USA) | 110 | |
| 3 | 1° niveau de diplôme universitaire | 115 | 85% |
| 34 | College Entrant (USA) | 115 | |
| 35 | Etudiants San Jose State University (USA) | 116,5 | |
| 34 | College Graduate (USA) | 120 | |
| 34 | Etudiants en Médecine (USA) | 120 | |
| 36 | Professeurs d'Agriculture Oxford University | 126,5 | |
| 36 | Moyenne Professeurs de Sciences Oxford University | 126,5 | |
| 36 | Professeurs de Mathématiques Oxford University | 130,4 | |
| 34 | Etudiants Harvard University (USA) | 127 | |
| 34 | PhD, MD, LLB, etc. (USA) | 130 | |
| 3 | Plus hauts diplômés Américains | 145 | 99% |
| 3 | Plus hauts diplômés Américains | 145 | 99% |
>100 : Pour illustration (calcul théorique) : pourcentage de personnes de la population considérée ayant un QI supérieur à 100 (REF = 0)
Courbes de distribution du QI en fonction du plus haut diplôme obtenu (USA) :
Sur l'échantillon de la Minnesota Twin Family Study (MTFS), ref 43 :
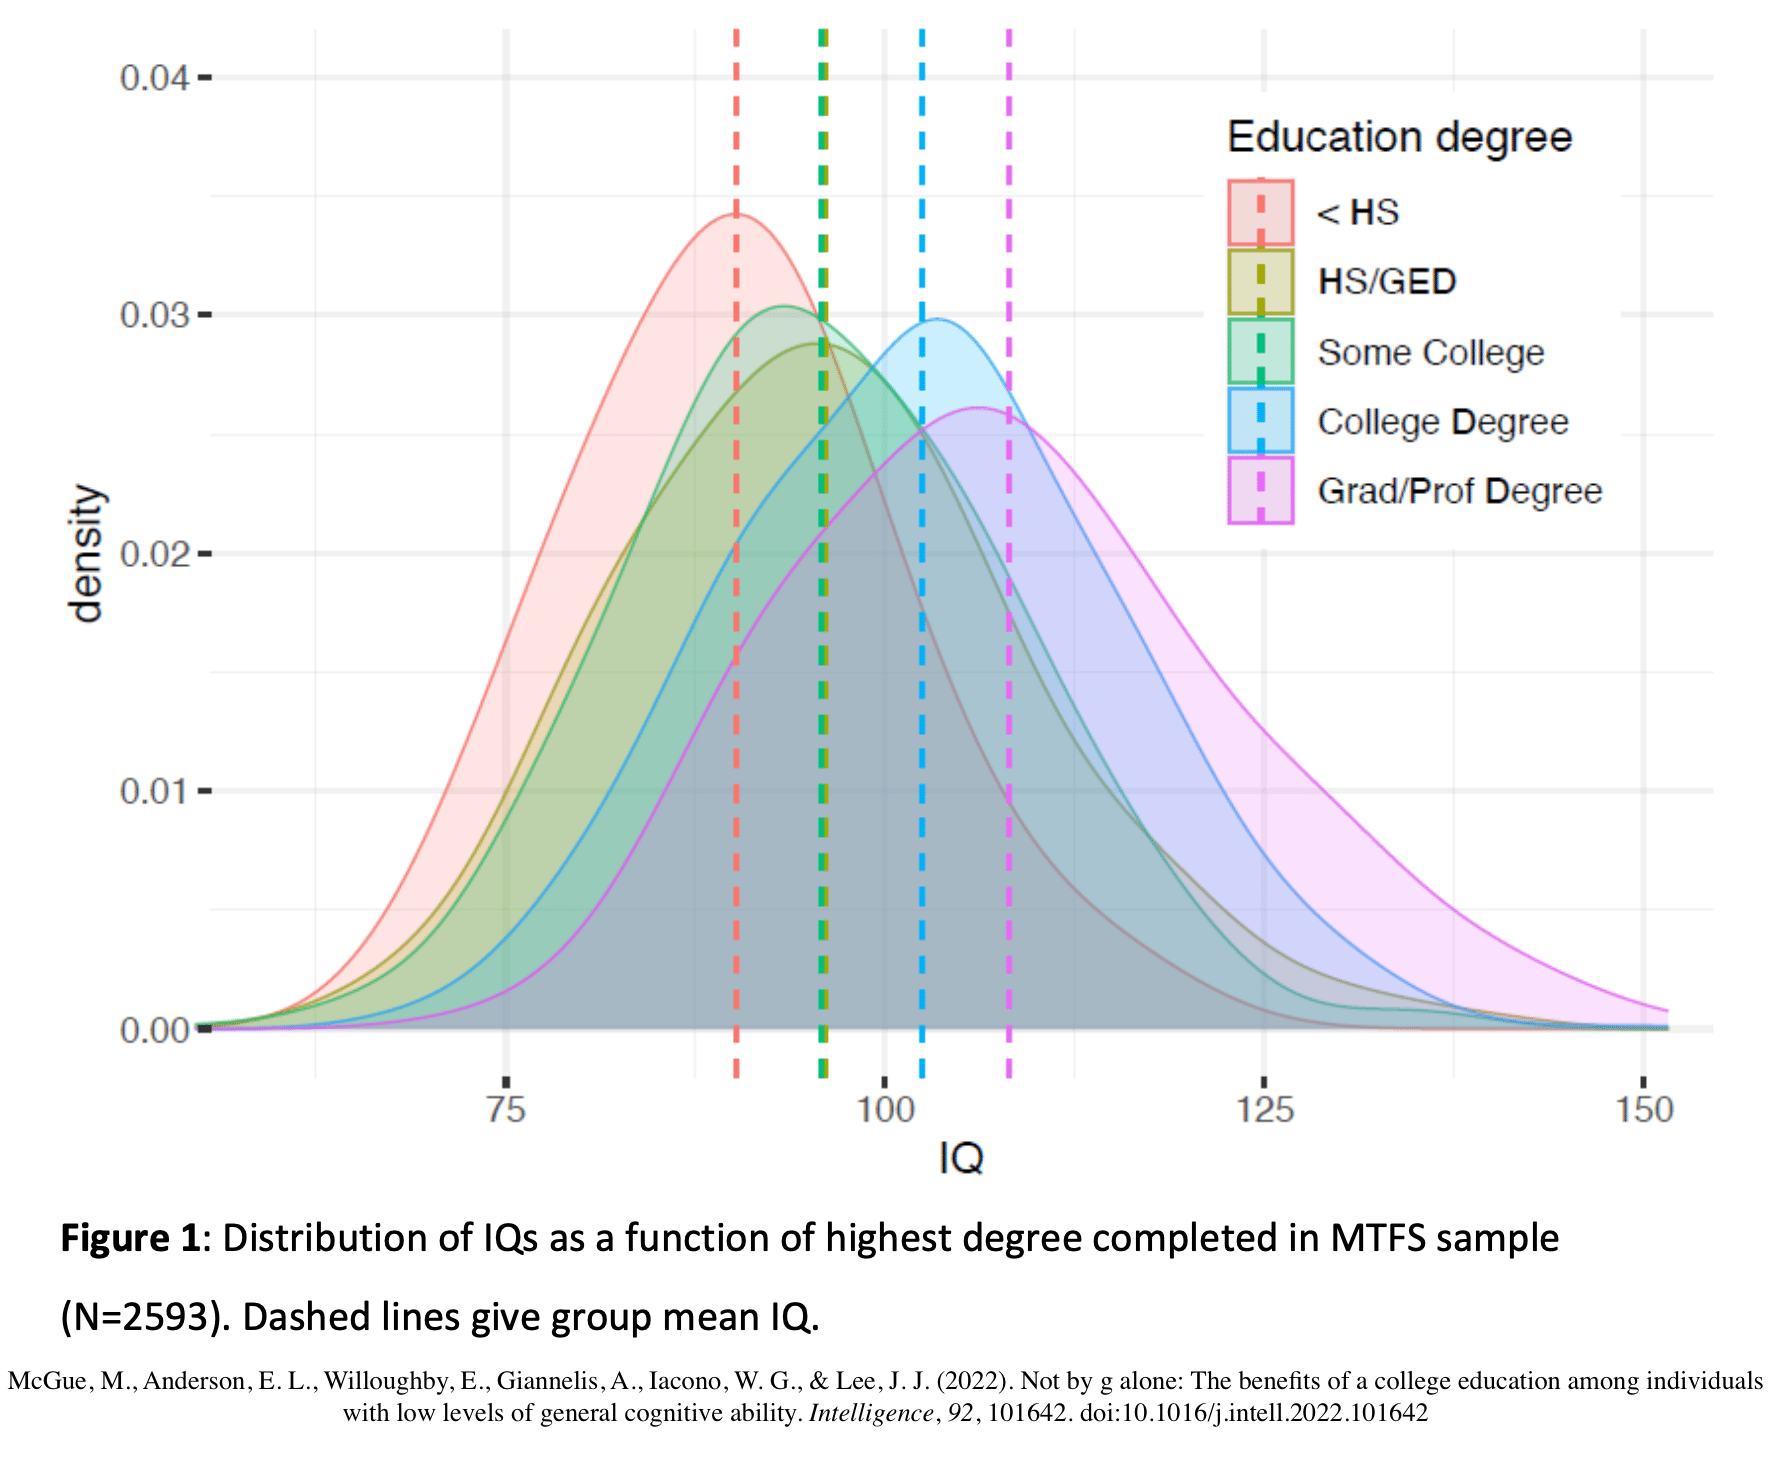
Voir : Éducation : un diplôme est-il encore une preuve de haut QI ?
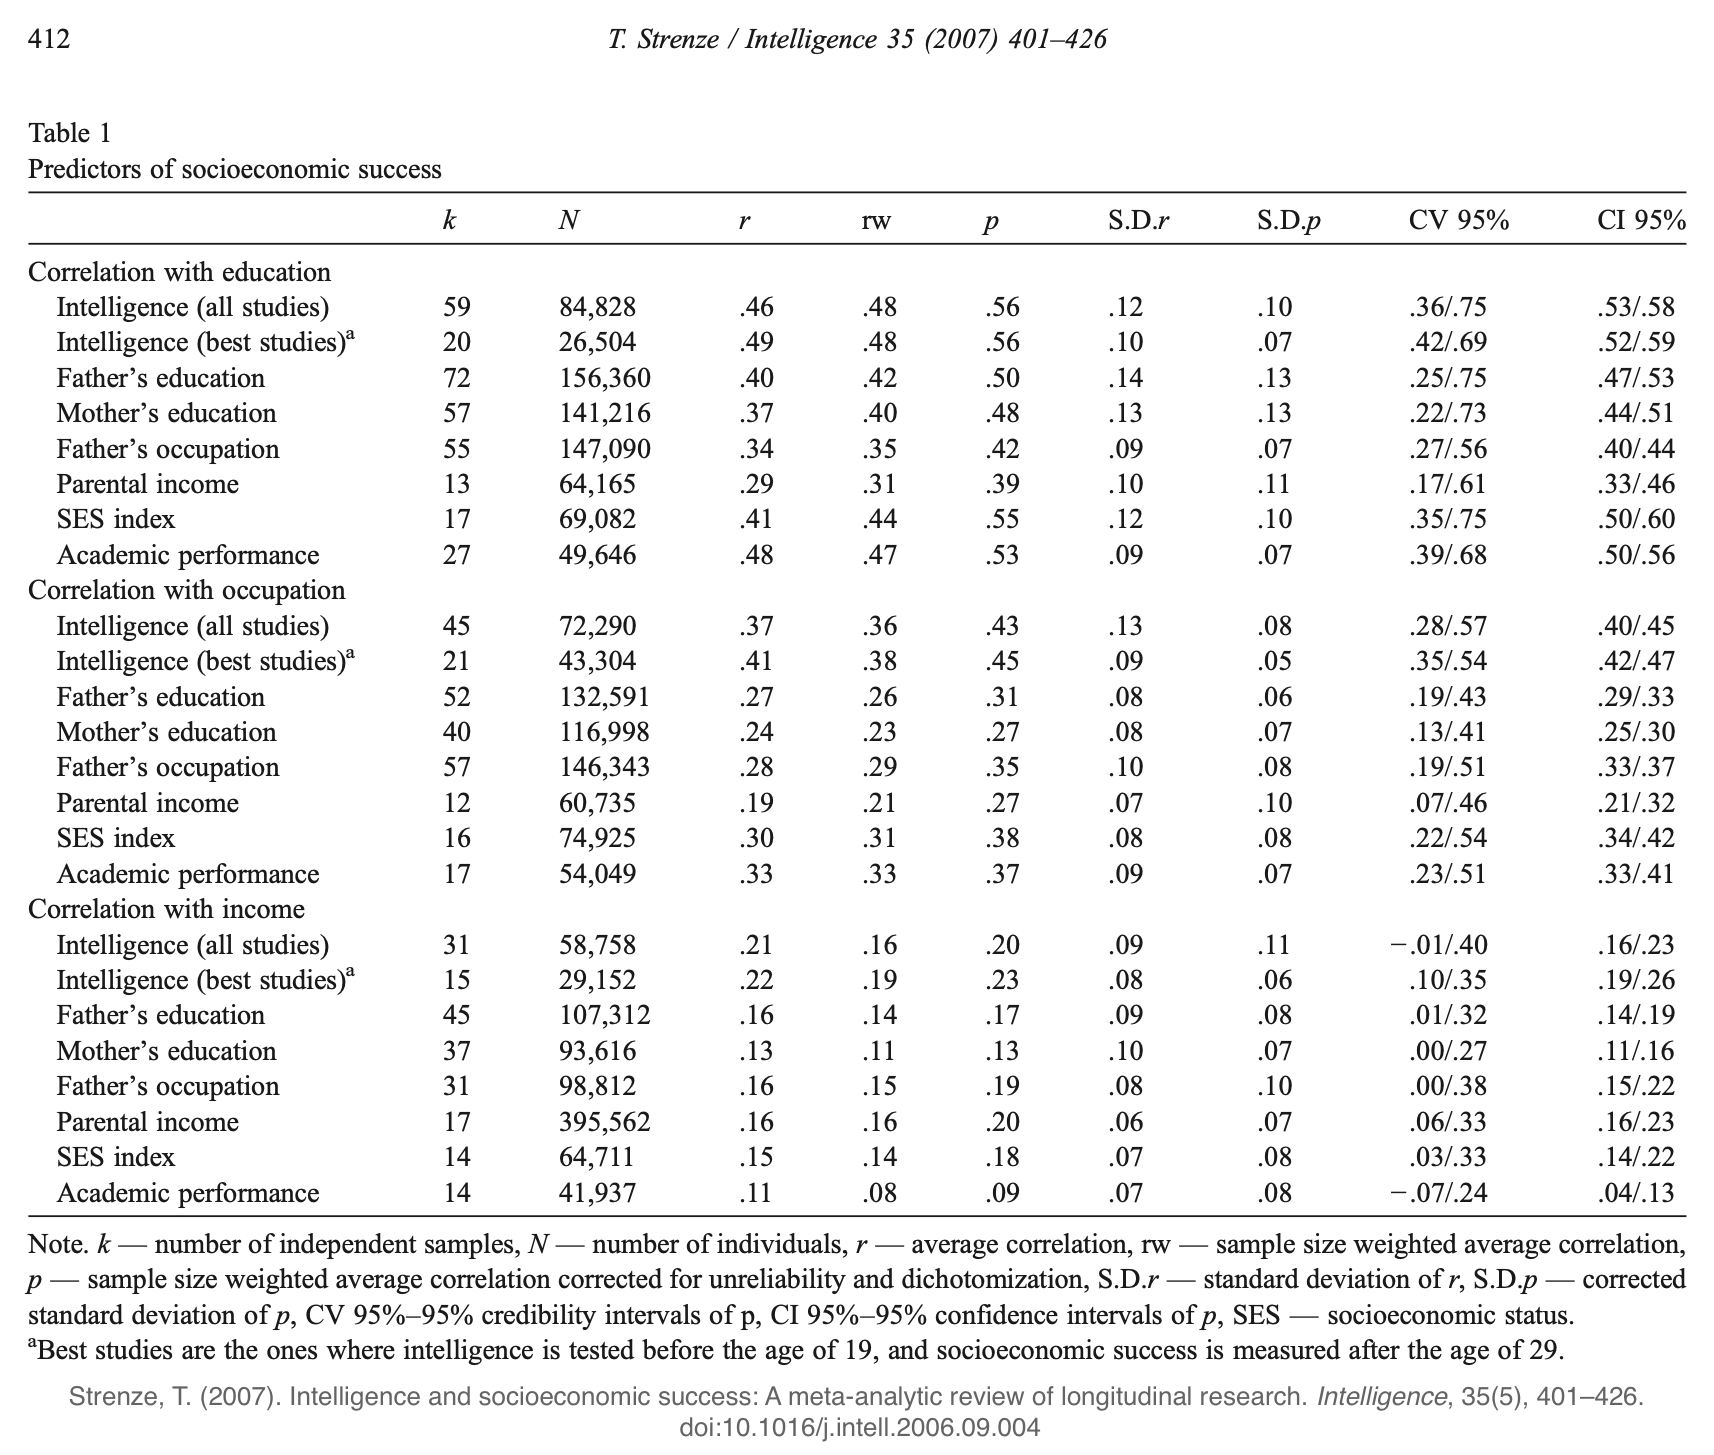
7. Corrélations QI - Éducation - Réussite professionnelle - Revenus
| Ref | CORRELATIONS DU QI AVEC : | Corrélation |
|---|---|---|
| 45 | Niveau d'éducation | 0,56 |
| 45 | Profession | 0,45 |
| 45 | Revenus | 0,23 |
Le QI est plus corrélé avec ces trois critères que le niveau d'éducation des parents, le métier du père, les revenus familiaux, le statut socioéconomique, et la réussite académique (Ref 45) :
8. QI moyen des professionnels de santé (USA)
| Ref | QI STANDARD MOYEN DES FOURNISSEURS DE SOINS | QI | > 100 |
|---|---|---|---|
| 42 | Médecins | 114,5 | |
| 42 | Dentistes | 108,4 | |
| 42 | Physiothérapeutes | 110,6 | |
| 42 | Autres thérapeutes | 109,4 | |
| 42 | Pharmaciens | 108,2 | |
| 42 | Infirmières autorisées | 104,6 | |
| 42 | Orthophonistes | 104,6 | |
| 42 | Diététiciens | 90,9 |
9. QI moyen et criminalité
| Ref | QI MOYEN SELON LE PLUS HAUT PROBLEME JUDICIAIRE VECU CHEZ LES HOMMES BLANCS (US) (DEEPEST LEVEL OF CONTACT with The CRIMINAL JUSTICE SYSTEM (WHITES MALES)) | QI | >100 |
|---|---|---|---|
| 6 | Aucun contact (None) | 106 | 66 |
| 6 | Arrêté par la police mais pas retenu (Stopped by Police but not booked) | 103 | 58 |
| 6 | Retenu mais pas condamné (Booked but not convicted) | 101 | 53 |
| 6 | Condamné mais pas incarcéré (Convicted but not incarcerated) | 100 | 50 |
| 6 | Condamné (Sentenced to a correctional facility) | 93 | 32 |
>100 : Pour illustration (calcul théorique) : pourcentage de personnes de la population considérée ayant un QI supérieur à 100 (REF = 0)
| Ref | QI et CRIME | CHIFFRE |
|---|---|---|
| 12 | Sur les crimes commis par les enfants scolarisés aux USA pourcentage de ceux commis par les QI compris entre 70 et 100 | 74% |
| 46 | Corrélation entre le QI et le taux d'homicide au Japon (par préfecture) | -0,60 |
Comparaison des perpétrations d'actes de violence en comparaison avec les personnes à QI compris entre 120 et 129 au Royaume Uni "Après ajustement des facteurs démographiques et comportementaux, de l'adversité dans l'enfance et de la morbidité psychiatrique" :
| Ref | QI et VIOLENCE (UK) | RATIO (IC à 95%) |
|---|---|---|
| 48 | QI : entre 70 et 79 | x 2,25 (1,26-4,01) |
| 48 | QI : entre 80 et 89 | x 2,36 (1,32-4,22) |
| 48 | QI : entre 90 et 999 | x 1,80 (1,05-3,13) |
| 48 | QI : entre 100 et 109 | x 1,90 (1,12-3,22) |
| 48 | QI : entre 110 et 119 | x 1,07 (0,63-1,84) |
IC : Intervalle de confiance
10. Impact sur le QI moyen de différentes conditions (exprimé en points QI Wechsler)
| Ref | IMPACT SUR LE QI STANDARD MOYEN | IMPACT | >100 |
|---|---|---|---|
| 27 | Poids à la naissance : points de QI apportés par 1 Kg de plus : Garçons Filles |
4,6 2,8 |
|
| 10 | Schizophrènes hospitalisés Schizophrènes non hospitalisés |
-31 -13 |
2 19 |
| 21 | QI des Jumeaux Monozygotes si les deux naissent viables | -5 | 37 |
| 21 | QI des Jumeaux Monozygotes dont un est mort-né | 0 | 50 |
| 29 | QI des Jumeaux à l'âge de 5 ans | -5,3 | 37 |
| 29 | QI des Jumeaux à l'âge de 9 ans | -6 | 34 |
| 24 | Enfants de 9 ans ayant souffert au moins une fois par an du parasite G. lamblia (provoque des diarrhées) | -4 | 40 |
| 24 | Enfants de 9 ans ayant souffert de malnutrition chronique pendant les deux premières années ayant entraîné un retard de croissance | -10 | 25 |
| 28 | Enfants de 5 ans qui avaient beaucoup pleuré à 6 et 13 semaines, 6, 9 et 13 mois | -9 | 27 |
| 28 | Enfants de 5 ans qui avaient beaucoup de coliques à 6 et 13 semaines, 6, 9 et 13 mois | 0 (pas d'impact trouvé) | 50 |
| 38 | A l'âge adulte : fumer régulièrement du cannabis depuis l'adolescence [a] | -8 | 30 |
>100 : Pour illustration (calcul théorique) : pourcentage de personnes de la population considérée ayant un QI supérieur à 100 (REF = 0)
[a] : Etude contestée par Réf. 39, la réponse à la contestation est Réf. 40
11. QI des américains de 10 ans par groupe ethnique
"Ces scores pondérés, présentés ci-dessous, représentent les scores de "performance neuropsychologique", mesurés entre 2016 et 2018, d'échantillons représentatifs d'enfants américains âgés de 10 ans. Les trois premières colonnes, après les étiquettes des groupes, affichent la taille de l'échantillon, les moyennes et les écarts-types, respectivement. La quatrième colonne présente les scores normalisés avec la moyenne des Blancs non hispaniques fixée à 100,00 et les écarts-types fixés à 15,00. Pour normaliser les scores, nous avons regroupé les écarts types de tous les groupes (écart type regroupé = 16,39) et transformé les valeurs à l'aide de l'écart type regroupé."
Human Varieties1
| Ref | Ethnic/National group | N | M | SD | IQ-metric scores | Parent Education (Years) |
|---|---|---|---|---|---|---|
| 47 | Korean & Japanese | 16 | 117.4 | 21.87 | 112.23 | 16.27 |
| 47 | Chinese | 43 | 115.79 | 14.67 | 110.76 | 16.96 |
| 47 | White & Asian Indian | 41 | 114.57 | 14.53 | 109.64 | 16.72 |
| 47 | White & Korean/Japanese | 71 | 110.88 | 18.22 | 106.26 | 16 |
| 47 | White & Chinese | 70 | 109.37 | 18.34 | 104.88 | 16.32 |
| 47 | White & Filipino | 55 | 109.07 | 17.57 | 104.6 | 16.19 |
| 47 | Asian Indian | 50 | 107.59 | 17.33 | 103.25 | 16.77 |
| 47 | Filipino | 36 | 107.09 | 17.26 | 102.79 | 15.34 |
| 47 | White | 5614 | 104.04 | 16.5 | 100 | 15.51 |
| 47 | Other Asian | 43 | 103.1 | 17.73 | 99.14 | 15.55 |
| 47 | N. Africa & Mid. East | 41 | 100.12 | 20.98 | 96.41 | 15.05 |
| 47 | White & Native American | 136 | 99.29 | 15.55 | 95.65 | 14.56 |
| 47 | Central & South American | 314 | 98.25 | 16.92 | 94.7 | 14.43 |
| 47 | Vietnamese | 12 | 96.04 | 14.45 | 92.68 | 15.94 |
| 47 | Not Identified | 202 | 95.76 | 15.5 | 92.42 | 13.83 |
| 47 | Dominican | 36 | 95.6 | 16.56 | 92.27 | 14.25 |
| 47 | White Mexican | 669 | 95.39 | 16.84 | 92.08 | 13.2 |
| 47 | NH Black & White | 397 | 95.16 | 16.69 | 91.87 | 14.21 |
| 47 | White Cuban | 146 | 95.06 | 16.16 | 91.78 | 13.97 |
| 47 | Other Hispanic | 484 | 94.89 | 17.87 | 91.62 | 14.06 |
| 47 | Black African | 57 | 93.8 | 13.44 | 90.63 | 14.79 |
| 47 | White Puerto Rican | 124 | 93.74 | 16.65 | 90.57 | 14.05 |
| 47 | Native American | 36 | 93.23 | 15.58 | 90.1 | 13.14 |
| 47 | Other Mexican | 366 | 92.68 | 16.33 | 89.6 | 12.25 |
| 47 | Black Caribbean | 46 | 91.66 | 17.19 | 88.67 | 14.3 |
| 47 | Other Cuban | 28 | 91.53 | 17.48 | 88.55 | 14.55 |
| 47 | Black & Other Puerto Rican | 75 | 90.91 | 15.94 | 87.98 | 13.68 |
| 47 | USA Black | 1426 | 85.51 | 14.77 | 83.04 | 13.43 |
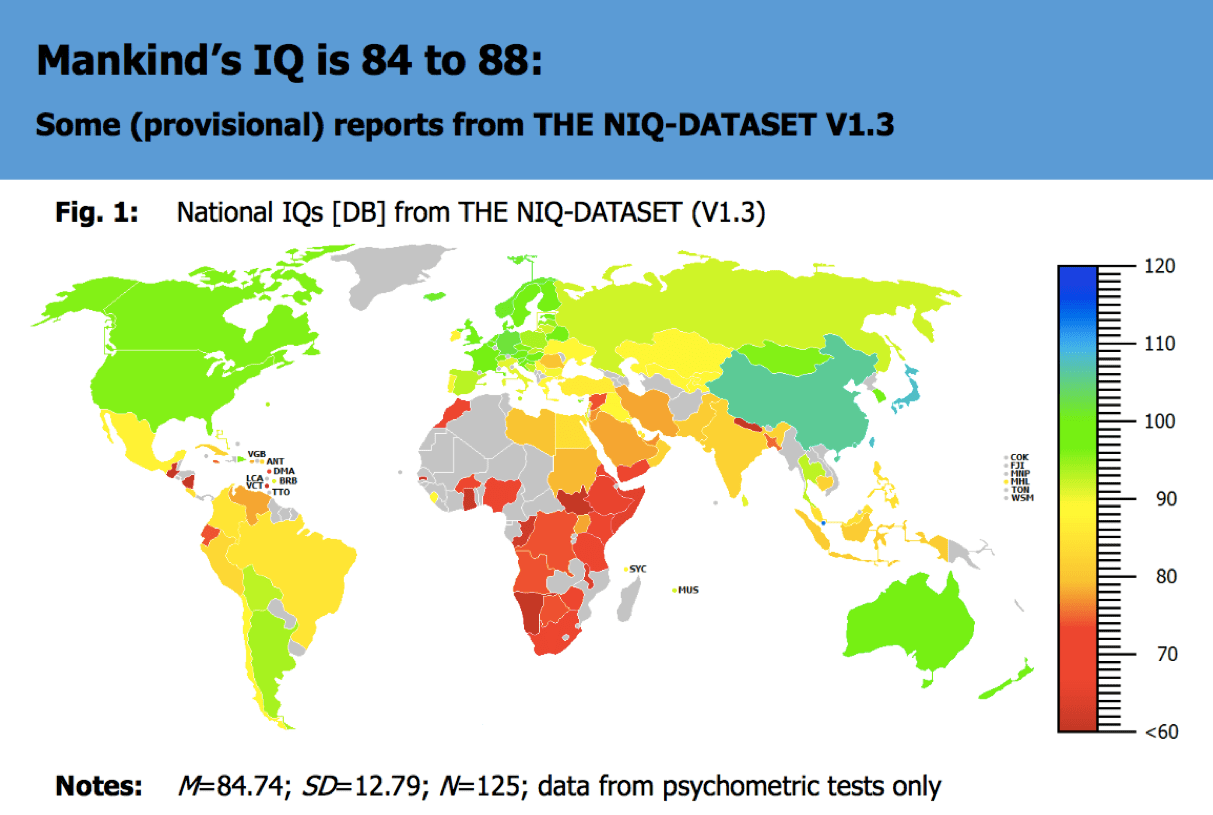
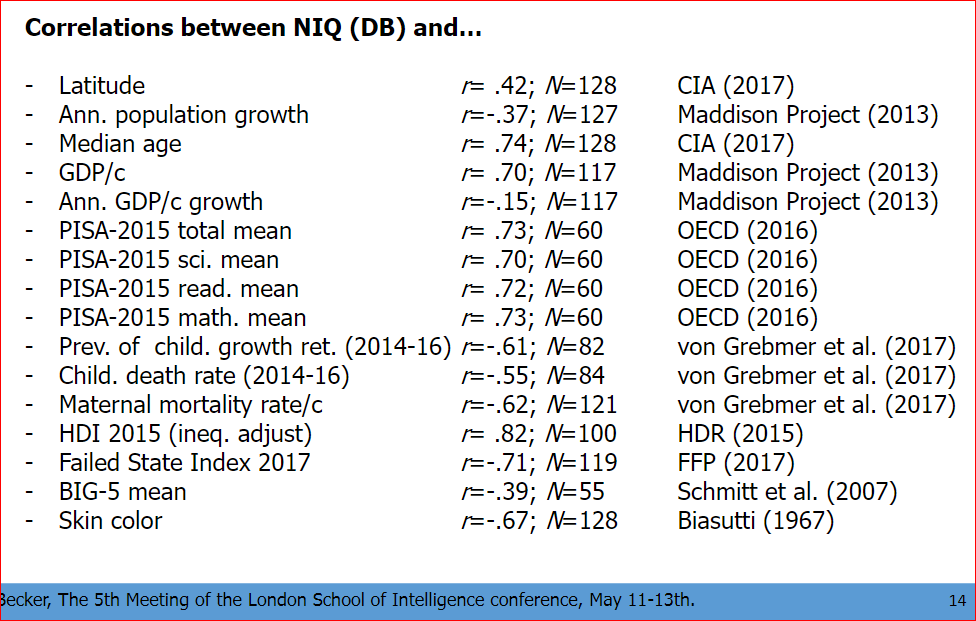
12. National IQ Dataset (NIQ), mai 2018
David Becker a présenté au 5th Meeting of the London School of Intelligence conference (11-13 mai 2018) l'état d'avancement de son Projet National IQ. Deux extraits :
Le QI moyen mondial est compris entre 84 et 88 :
Le QI national est fortement corrélé avec :
Sources :
Téléchargement (PDF) : Becker, D. (2018). Mankind’s IQ is 84 to 88 : Some (provisional) reports from The NIQ-Dataset v1.3. The 5th Meeting of the London School of Intelligence conference, May 11-13th.
Trouvé via : World IQ: Latest Update. James Thompson. May 15, 2018
13. QI moyen par pays selon R. Lynn Et T. Vanhanen (2002)
Voir la page de présentation du livre (avec commentaires supplémentaires de Richard Lynn) : IQ and the Wealth of Nations (Lynn & Vanhanen, 2002).
La thèse du livre est qu'environ 60% de la variance économique entre les pays s'explique par le QI moyen de la population. Toujours selon Lynn & Vanhanen, 3 éléments viennent baisser la corrélation (qui, sans eux, serait plus importante) :
Le degré de liberté économique : les pays ayant vécu (ou vivant encore) le communisme sont bien sûr beaucoup plus pauvres que les autres
La quantité des ressources naturelles (ex : le pétrole au Moyen-Orient)
L'organisation interne du pays : mettre l'élite intellectuelle au pouvoir économique augmente la richesse globale de tous.
Légende
Average IQ = QI Moyen
GDP = PIB (Produit Intérieur Brut)
Fitted GDP (FGDP) = GDP recalculé selon le rapport moyen trouvé par Lynn et Vanhanen
GDP / FGDP = indique si le pays réussit mieux ou moins bien que son QI ne le laisse supposer
Les chiffres
| Country | Average IQ | GDP | Fitted GDP | GDP/FGDP |
|---|---|---|---|---|
| Hong Kong | 107 | 20 763 | 19 817 | 1,0477368 |
| Korea, South | 106 | 13 478 | 19 298 | 0,6984143 |
| Japan | 105 | 23 257 | 18 779 | 1,2384579 |
| Taiwan | 104 | 13 000 | 18 260 | 0,7119387 |
| Singapore | 103 | 24 210 | 17 740 | 1,3647125 |
| Austria | 102 | 23 166 | 17 221 | 1,345218 |
| Germany | 102 | 22 169 | 17 221 | 1,2873236 |
| Italy | 102 | 20 585 | 17 221 | 1,1953429 |
| Netherlands | 102 | 22 176 | 17 221 | 1,2877301 |
| Sweden | 101 | 20 659 | 16 702 | 1,2369177 |
| Switzerland | 101 | 25 512 | 16 702 | 1,5274817 |
| Belgium | 100 | 23 223 | 16 183 | 1,4350244 |
| China | 100 | 3 105 | 16 183 | 0,191868 |
| NewZealand | 100 | 17 288 | 16 183 | 1,0682815 |
| U. Kingdom | 100 | 20 336 | 16 183 | 1,2566273 |
| Hungary | 99 | 10 232 | 15 664 | 0,6532176 |
| Poland | 99 | 7 619 | 15 664 | 0,4864019 |
| Australia | 98 | 22 452 | 15 145 | 1,4824695 |
| Denmark | 98 | 24 218 | 15 145 | 1,5990756 |
| France | 98 | 21 175 | 15 145 | 1,3981512 |
| Norway | 98 | 26 342 | 15 145 | 1,7393199 |
| United States | 98 | 29 605 | 15 145 | 1,9547706 |
| Canada | 97 | 23 582 | 14 626 | 1,6123342 |
| Czech Republic | 97 | 12 362 | 14 626 | 0,8452072 |
| Finland | 97 | 20 847 | 14 626 | 1,4253384 |
| Spain | 97 | 16 212 | 14 626 | 1,108437 |
| Argentina | 96 | 12 013 | 14 107 | 0,8515631 |
| Russia | 96 | 6 460 | 14 107 | 0,4579287 |
| Slovakia | 96 | 9 699 | 14 107 | 0,687531 |
| Uruguay | 96 | 8 623 | 14 107 | 0,6112568 |
| Portugal | 95 | 14 701 | 13 589 | 1,0818309 |
| Slovenia | 95 | 14 293 | 13 588 | 1,051884 |
| Israel | 94 | 17 301 | 13 069 | 1,3238197 |
| Romania | 94 | 5 648 | 13 069 | 0,4321677 |
| Bulgaria | 93 | 4 809 | 12 550 | 0,3831873 |
| Ireland | 93 | 21 482 | 12 550 | 1,7117131 |
| Greece | 92 | 13 943 | 12 031 | 1,1589228 |
| Malaysia | 92 | 8 137 | 12 031 | 0,6763361 |
| Thailand | 91 | 5 456 | 11 512 | 0,4739402 |
| Croatia | 90 | 6 749 | 10 993 | 0,6139361 |
| Peru | 90 | 4 282 | 10 993 | 0,3895206 |
| Turkey | 90 | 6 422 | 10 993 | 0,5841899 |
| Colombia | 89 | 6 006 | 10 474 | 0,5734199 |
| Indonesia | 89 | 2 651 | 10 474 | 0,2531029 |
| Suri name | 89 | 5 161 | 10 474 | 0,4927439 |
| Brazil | 87 | 6 625 | 9 436 | 0,7020983 |
| Iraq | 87 | 3 197 | 9 436 | 0,3388088 |
| Mexico | 87 | 7 704 | 9 436 | 0,8164476 |
| Samoa (Western) | 87 | 3 832 | 9 436 | 0,4061043 |
| Tonga | 87 | 3 000 | 9 436 | 0,3179313 |
| Lebanon | 86 | 4 326 | 8 917 | 0,4851407 |
| Philippines | 86 | 3 555 | 8 917 | 0,3986767 |
| Cuba | 85 | 3 967 | 8 398 | 0,4723744 |
| Morocco | 85 | 3 305 | 8 398 | 0,3935461 |
| Fiji | 84 | 4 231 | 7 879 | 0,5369971 |
| Iran | 84 | 5 121 | 7 879 | 0,6499556 |
| Marshall Islands | 84 | 3 000 | 7 879 | 0,380759 |
| Puerto Rico | 84 | 8 000 | 7 879 | 1,0153573 |
| Egypt | 83 | 3 041 | 7 360 | 0,4131793 |
| India | 81 | 2 077 | 6 322 | 0,3285353 |
| Ecuador | 80 | 3 003 | 5 803 | 0,517491 |
| Guatemala | 79 | 3 505 | 5 284 | 0,6633232 |
| Barbados | 78 | 12 001 | 4 765 | 2,5185729 |
| Nepal | 78 | 1 157 | 4 765 | 0,2428122 |
| Qatar | 78 | 20 987 | 4 765 | 4,4044071 |
| Zambia | 77 | 719 | 4 246 | 0,1693358 |
| Congo (Brazz) | 73 | 995 | 2 170 | 0,4585253 |
| Uganda | 73 | 1 074 | 2 170 | 0,4949309 |
| Jamaica | 72 | 3 389 | 1 651 | 2,0526953 |
| Kenya | 72 | 980 | 1 651 | 0,5935796 |
| South Africa | 72 | 8 488 | 1 651 | 5,1411266 |
| Sudan | 72 | 1 394 | 1 651 | 0,8443368 |
| Tanzania | 72 | 480 | 1 651 | 0,2907329 |
| Ghana | 71 | 1 735 | 1 132 | 1,5326855 |
| Nigeria | 67 | 795 | - 944 | -0,842161 |
| Guinea | 66 | 1 782 | - 1 463 | -1,218045 |
| Zimbabwe | 66 | 2 669 | - 1 463 | -1,824334 |
| Congo (Zaire) | 65 | 822 | - 1 982 | -0,414733 |
| Sierra Leone | 64 | 458 | - 2 501 | -0,183127 |
| Ethiopia | 63 | 574 | - 3 020 | -190,0662 |
| Equatorial Guinea | 59 | 1 817 | - 5 096 | -0,356554 |
Sources et références
| Ref | SOURCES |
|---|---|
| 0 | Calcul pour une moyenne de 100 ATTENTION : n'est valide que si la représentation des QI dans la population considérée suit bien une courbe en cloche (cela est vrai pour la population générale mais pas forcément pour une population particulière) SE RAPPELLER EGALEMENT que les variations à l'intérieur d'un groupe sont généralement plus importantes que les variations entre les groupes : il ne s'agit que de moyenne |
| 1 | Jaques Bénesteau (sur ce site) |
| 2 | Devlin, B., Daniels, M. & Roeder, K. The heritability of IQ. Nature 388, 468–471 (1997). doi:10.1038/41319 |
| 3 | Herrnstein & Murray - The Bell Curve (1994) |
| 4 | Estimation Arthur Hu (Estimate Arthur Hu) : voir sa page |
| 5 | Par définition |
| 6 | TBC pp 246-247 |
| 7 | Jean-Philippe Rushton - 2000 |
| 8 | Wiegmann et al. 1992 (Cite par Brand 1996 pp 154 et 207) Wiegman, O., Kuttschreuter, M. & Baarda, B. (1992). A longitudinal study of The effects of television viewing on aggressive and prosocial behaviours. British Journal of Social Psychology 31, 147-164. |
| 9 | Egan 1989 |
| 10 | John Crawford 1992 |
| 11 | White, K.R. 1982 (cité in Brand 1996) The relation between socioeconomic status and academic achievement. Psychological Bulletin 91, 3, 461-8 |
| 12 | Yoshikawa |
| 13 | Jensen A.R. 1978 (cité in TBC pp 110 et 687) : Genetic and behavioral effects of nonrandom mating. Human Variation : Biopsychology of Age, Race and Sex. R.T. Osborne, C.E. Noble, and N. Weyl (eds.). New York : Academic Press, pp. 5-105 Voir aussi : Jensen 1998 p 183 |
| 14 | Chris Brand |
| 15 | Hunter J. E. & Hunter R.F. (1984). Validity and utility of alternative predictors of job performance. Psychological Bull. 96:72-98 (cité in TBC pp 81 et 575) |
| 16 | Jensen 1998 - p 149 |
| 17 | Phil Rushton in Race, Evolution and Behaviour (1995), p70 (Diagram) |
| 18 | Tom Bouchard and Matt McGue (1981). Familial studies of intelligence. Science 212, 4498, 1055-1059) |
| 19 | Jensen 1998 - pp 169 et 178 + graphique page 179 from Mac Gue 1993 : voir REF 20 ci-dessous |
| 20 | Jensen 1998 p 178 - Sources citées : - Mc Gue et al., 1993, pp. 60-67 (Behavioral genetics of cognitive ability : a life time perspective in R. Plomin & G.E. McClearn (Eds.), Nature, Nurture, and psychology (pp 59-76). Washington, DC: American Psychological Association) - Scarr, 1989 pp 103-105 (Protecting general intelligence : constructs and consequences for interventions. In R.L. Linn (Ed.), Intelligence : Measurement, Theory, and public policy (pp 74-118) Chicago : University of Illinois Press) - Segal 1997 (Same age unrelated siblilngs : a unique test of within-family environmental influences on IQ similarity. Journal of Educational Psychology, 89, 381-390) |
| 21 | Record, R. G., McKeown, T & Edwards, J. H. (1970). An investigation of The differences in measured intelligence between twin and single births. Annals of Human Genetics 34, 11-20. |
| 22 | INED (France) 1973 |
| 23 | Lynn et Vanhanen 2002 : IQ and The Wealth of Nation - Praeger (USA) 2002 Données disponibles à : http://www.isteve.com/IQ_Table.htm |
| 24 | Douglas S. Berkman et al. (2002). Effects of stunting, diarrhoeal disease, and parasitic infection during infancy on cognition in late childhood: a follow up study. The Lancet 16-02-2002 |
| 25 | Calcul de Razib (Gène Expression) à partir des données de #23 et Pew. Chiffres disponibles ici. |
| 26 | Corrélation significative trouvée par Voracek, Martin (2003), à partir des mêmes données que Lynn & Vanhanen 2002 [23] : Voracek, M. (2004). National intelligence and suicide rate: an ecological study of 85 countries. Personality and Individual Differences, 37(3), 543–553 doi:10.1016/j.paid.2003.09.025 |
| 27 | Matte, T. D., Bresnahan, M., Begg, M. D., & Susser, E. (2001). Influence of variation in birth weight within normal range and within sibships on IQ at age 7 years: cohort study. BMJ, 323(7308), 310–314. doi:10.1136/bmj.323.7308.310 |
| 28 | Rao, M. R., Brenner, R. A., Schisterman, E. F., Vik, T., & Mills, J. L. (2004). Long term cognitive development in children with prolonged crying. Arch Dis Child, 89(January 1986), 989–992. doi:10.1136/adc.2003.039198 |
| 29 | Ronalds, G. a, De Stavola, B. L., & Leon, D. a. (2005). The cognitive cost of being a twin: evidence from comparisons within families in the Aberdeen children of the 1950s cohort study. BMJ (Clinical Research Ed.), 331(7528), 1306. doi:10.1136/bmj.38633.594387.3A |
| 30 | Prokosch, M., Yeo, R., & Miller, G. (2005). Intelligence tests with higher g loadings show higher correlations with body symmetry: Evidence for a general fitness factor mediated by developmental stability. Intelligence, 33(2), 203–213. doi:10.1016/j.intell.2004.07.007 |
| 31 | Detterman, D. (To Be Published). Validity. In The Science of Intelligence (Chap. 6). |
| 32 | Deary, I. J., Strand, S., Smith, P., & Fernandes, C. (2007). Intelligence and educational achievement. Intelligence, 35(1), 13–21. doi:10.1016/j.intell.2006.02.001. Cité par Detterman (Ref. 31) p.7. |
| 33 | Detterman (Ref. 31, p. 9) qui cite Dillon (1949, p. 34) et Matarazzo (1972, p. 283) |
| 34 | Detterman (Ref. 31, Table 6.3 p. 11) d'après Cronbach, 1960 |
| 35 | Detterman (Ref. 31, p. 11) qui cite Plant & Richardson (1958) |
| 36 | Detterman (Ref. 31, p. 12) qui cite Gibson & Light (1967) |
| 37 | Carl, N. (2014). Verbal intelligence is correlated with socially and economically liberal beliefs. Intelligence, 44(1), 142–148. doi:10.1016/j.intell.2014.03.005 |
| 38 | Meier, M. H., Caspi, A., Ambler, A., Harrington, H., Houts, R., Keefe, R. S. E.,... Moffitt, T. E. (2012). Persistent cannabis users show neuropsychological decline from childhood to midlife. Proceedings of the National Academy of Sciences of the United States of America, 109(40), E2657–64. doi:10.1073/pnas.1206820109 |
| 39 | Rogeberg, O. (2013). Correlations between cannabis use and IQ change in the Dunedin cohort are consistent with confounding from socioeconomic status. Proceedings of the National Academy of Sciences. doi:10.1073/pnas.1215678110 |
| 40 | Moffitt, T. E., Meier, M. H., Caspi, A., & Poulton, R. (2013). Reply to Rogeberg and Daly: No evidence that socioeconomic status or personality differences confound the association between cannabis use and IQ decline. Proceedings of the National Academy of Sciences, 110(11), E980–E982. doi:10.1073/pnas.1300618110 |
| 41 | Lynn, R., Harvey, J., & Nyborg, H. (2009). Average intelligence predicts atheism rates across 137 nations. Intelligence, 37(1), 11–15. doi:10.1016/j.intell.2008.03.004 |
| 42 | Data: What is the average IQ of your healthcare providers?. Ron Guhname. The Inductivist. 5 avril 2019 |
| 43 | McGue, M., Anderson, E. L., Willoughby, E., Giannelis, A., Iacono, W. G., & Lee, J. J. (2022). Not by g alone: The benefits of a college education among individuals with low levels of general cognitive ability. Intelligence, 92, 101642 doi:10.1016/j.intell.2022.101642 |
| 44 | Pietschnig, J., Gerdesmann, D., Zeiler, M., & Voracek, M. (2022). Of differing methods, disputed estimates and discordant interpretations: the meta-analytical multiverse of brain volume and IQ associations. Royal Society Open Science, 9(5) doi:10.1098/rsos.211621 |
| 45 | Strenze, T. (2007). Intelligence and socioeconomic success: A meta-analytic review of longitudinal research. Intelligence, 35(5), 401–426 doi:10.1016/j.intell.2006.09.004 |
| 46 | Kura, K. (2013). Japanese north-south gradient in IQ predicts differences in stature, skin color, income, and homicide rate. Intelligence, 41(5), 512–516 doi:10.1016/j.intell.2013.07.001 Voir page dédiée : Le QI des Japonais |
| 47 | IQ scores by ethnic group in a nationally-representative sample of 10-year old American children. Human Varieties. May 27, 2023 Echantillons : Adolescent Brain Cognitive Development℠ Study (ABCD Study®) du National Institutes of Health (NIH) aux USA |
| 48 | Jacob, L., Haro, J. M., & Koyanagi, A. (2019). Association between intelligence quotient and violence perpetration in the English general population. Psychological Medicine, 49(8), 1316–1323. doi:10.1017/S0033291718001939 |
Pour en savoir plus
Sur ce site
Autres sites
Historique des versions
| Date | Description |
|---|---|
| 11 mars 24 | MàJ Réf. 2 |
| 10 jan 24 | Ajout Réf. 48 (QI et violence au Royaume-Uni) |
| 8 jan 24 | Ajout liens à A lire en premier - Disclaimer |
| 29 mai 23 | Ajout 11. QI des américains de 10 ans par groupe ethnique (Ref 47) - MàJ Ref 26 |
| 1 fév 23 | Mise à jour lien 7 mythes du QI |
| 4 déc 22 | Ajout : Réf. 46 (Corrélations QI - blancheur de peau - divorce - crime) |
| 7 nov 22 | Ajout : Réf. 45 (Corrélations QI - Éducation - Réussite professionnelle - Revenus) |
| 30 mai 22 | Ajout : Réf. 44 (Méta-étude taille du crâne) |
| 10 mai 19 | Ajout : QI moyen des professionnels de santé (USA) |
| 16 mai 18 | Ajout : National IQ Dataset (NIQ), mai 2018 |
| 22 août 16 | Ajout : Réf. 41 (athéisme) - Réorganisation |
| 21 août 16 | Ajouts : Réf. 37 (politique) et 38 - 40 (cannabis) |
| 20 août 16 | Réorganisation MàJ : Références Ajouts : Réf. 30 à 36 |
| 4 sept 15 | Redesign |
| 24 nov 11 | Redesign |
| 2 dec 05 | Ajout : QI des Jumeaux |
| 07 nov 04 | Ajouts : Pleurs fréquents - Lien Charles Murray |
| 22 aout 04 | Ajout : Poids à la naissance |
| 27 déc 03 | Ajouts : Religiosité - Suicide |
| 31 mars 02 | Compléments |
| 25 nov 00 | Compléments |
| 14 oct 00 | Compléments |
| 09 oct 00 | 1ère mise en ligne |
Notes
-
Traduction depuis :
"These weighted scores, reported below, represent the “neuropsychological performance” scores, measured between 2016 and 2018, of representative samples of 10-year-old American children. The first three columns, after the group labels, display the sample size, means, and standard deviations, respectively. The fourth column presents the scores normalized with the non-Hispanic White mean set to 100.00 and standard deviations set to 15.00. To norm scores, we pooled the standard deviations across all groups (pooled SD = 16.39) and transformed the values using the pooled SD."
Human Varieties